A backtest that had been lying for months
Three separate mechanisms, found in the same engine, each of which caused it to report a number it had not earned. None of them threw an error. Two of them made the results look better, which is why they survived so long.
- System
- Strategy backtester and parameter optimizer
- Written in
- Node.js, worker threads
- Found by
- Disbelieving an equity curve
- Regression tests
- One per defect, permanent
Why this is the first thing I check
Nobody hires a Pine developer to produce a bad backtest. They hire one to produce a good backtest, which means the incentive on every line of exit-handling code points in one direction.
A backtest bug that loses money gets found in an afternoon, because the number offends you. A backtest bug that makes money gets tuned on for months, because the number flatters you, and every parameter you pick afterwards is picked to exploit it.
So before I tune anything, I check that the fills could have happened.
Trailing-stop exits in a single ADA one-hour run that filled at a price outside the range of the bar they filled on. The market never traded there.
The same configuration's reported return, before and after those fills were made impossible.
A stop that had drifted behind the market
The trailing stop activated on a threshold test: has the trail level — the running watermark, offset by the trail distance — cleared the entry price by enough to take over? Reasonable, and wrong, because it never asked where the level sat relative to the price right now.
The watermark was never invalidated when price moved against the position. Meanwhile the strategy averaged down, which pulls the entry price toward the market. Eventually a watermark from a days-old extreme cleared a threshold measured against an entry that had quietly moved to meet it — while the trade was under water.
The stop was now on the wrong side of the market. The next bar touched it trivially. The engine filled at the stop level and booked a profit that could not exist.
The live executor had the identical hole. There it was worse than a bad number: activation cancels the remaining safety ladder, so the position market-exits immediately at a real, realised loss.
// before: does the LEVEL clear entry?
if (level - entry >= activation)
    takeOver(level)

// the level was never compared
// to the current price at all.

// after: a stop cannot be armed
// on the far side of the market.
if (level >= close)
    watermark = close
    level     = recompute(watermark)

if (distance == 0)
    trailNothing()
Any run combining averaging-down with a trailing stop over-reported, in exactly those trades. Saved comparisons made before the fix are inflated and were re-run, not adjusted.
An objective function that selected for losing
The optimizer offered payoff ratio as a ranking objective: average win divided by average loss. It is a useful lens. It is not a profitability target, and the difference is not academic.
Payoff ratio is blind to win rate by construction. Maximise it and you select for wide-take-profit, tight-stop geometry — a shape that wins rarely and loses constantly, and scores beautifully. Successive runs re-centred the parameter ranges on each winner, so the drift compounded.
The tell was in the consistency column, not the objective: profitable pairs fell from 52 of 84 to 3 of 84 while the score improved. A winning combination with 3 of 84 profitable does not mean the optimizer failed. It means the entire swept region was bad and it dutifully returned the least-bad point in it.
| Run | Objective score | Pairs profitable |
|---|---|---|
| First | improving | 52 / 84 |
| Later | improving | 3 / 84 |
Fixed by gating in place: geometry objectives now score any negative-return result below every profitable one, ordered by total return. Profitable ranking is untouched, so the lens still works when you want it.
A sweep that never tested its own maximum
Parameter ranges were generated by accumulating a step in a loop. With a decimal step, floating-point drift pushes the accumulator past the maximum a fraction early and the loop drops its final value. A range of 0 to 3 in steps of 0.1 produced thirty values, not thirty-one.
Two of those ranges together meant a sweep the interface estimated at 961 combinations actually ran 900 — and the top of every range was never tested. The missing 61 looked like a hard cap on combinations. There was no cap.
Now the values are index-based, with an epsilon-guarded count shared between the estimate and the run, and a test forbids the old formula from coming back.
What the interface promised the sweep would cover.
What it covered. Every parameter's maximum sat in the missing 61.
What the engine does now
Once the numbers are trustworthy, the interesting question is whether an edge survives leaving the symbol it was found on. The optimizer scores every candidate across the whole pair list and ranks by the median of the per-pair objective — a mean lets one lucky pair carry a bad configuration, and pooling all trades together just hands the decision to whichever pair trades most.
Each result carries how many pairs were profitable, which was worst, and the full per-pair breakdown. Pairs with less than half the requested history are skipped rather than quietly averaged in, and low-sample pairs can be excluded from the median entirely.
It streams one pair at a time, so memory stays flat whether the list holds twelve symbols or a hundred and seventeen.
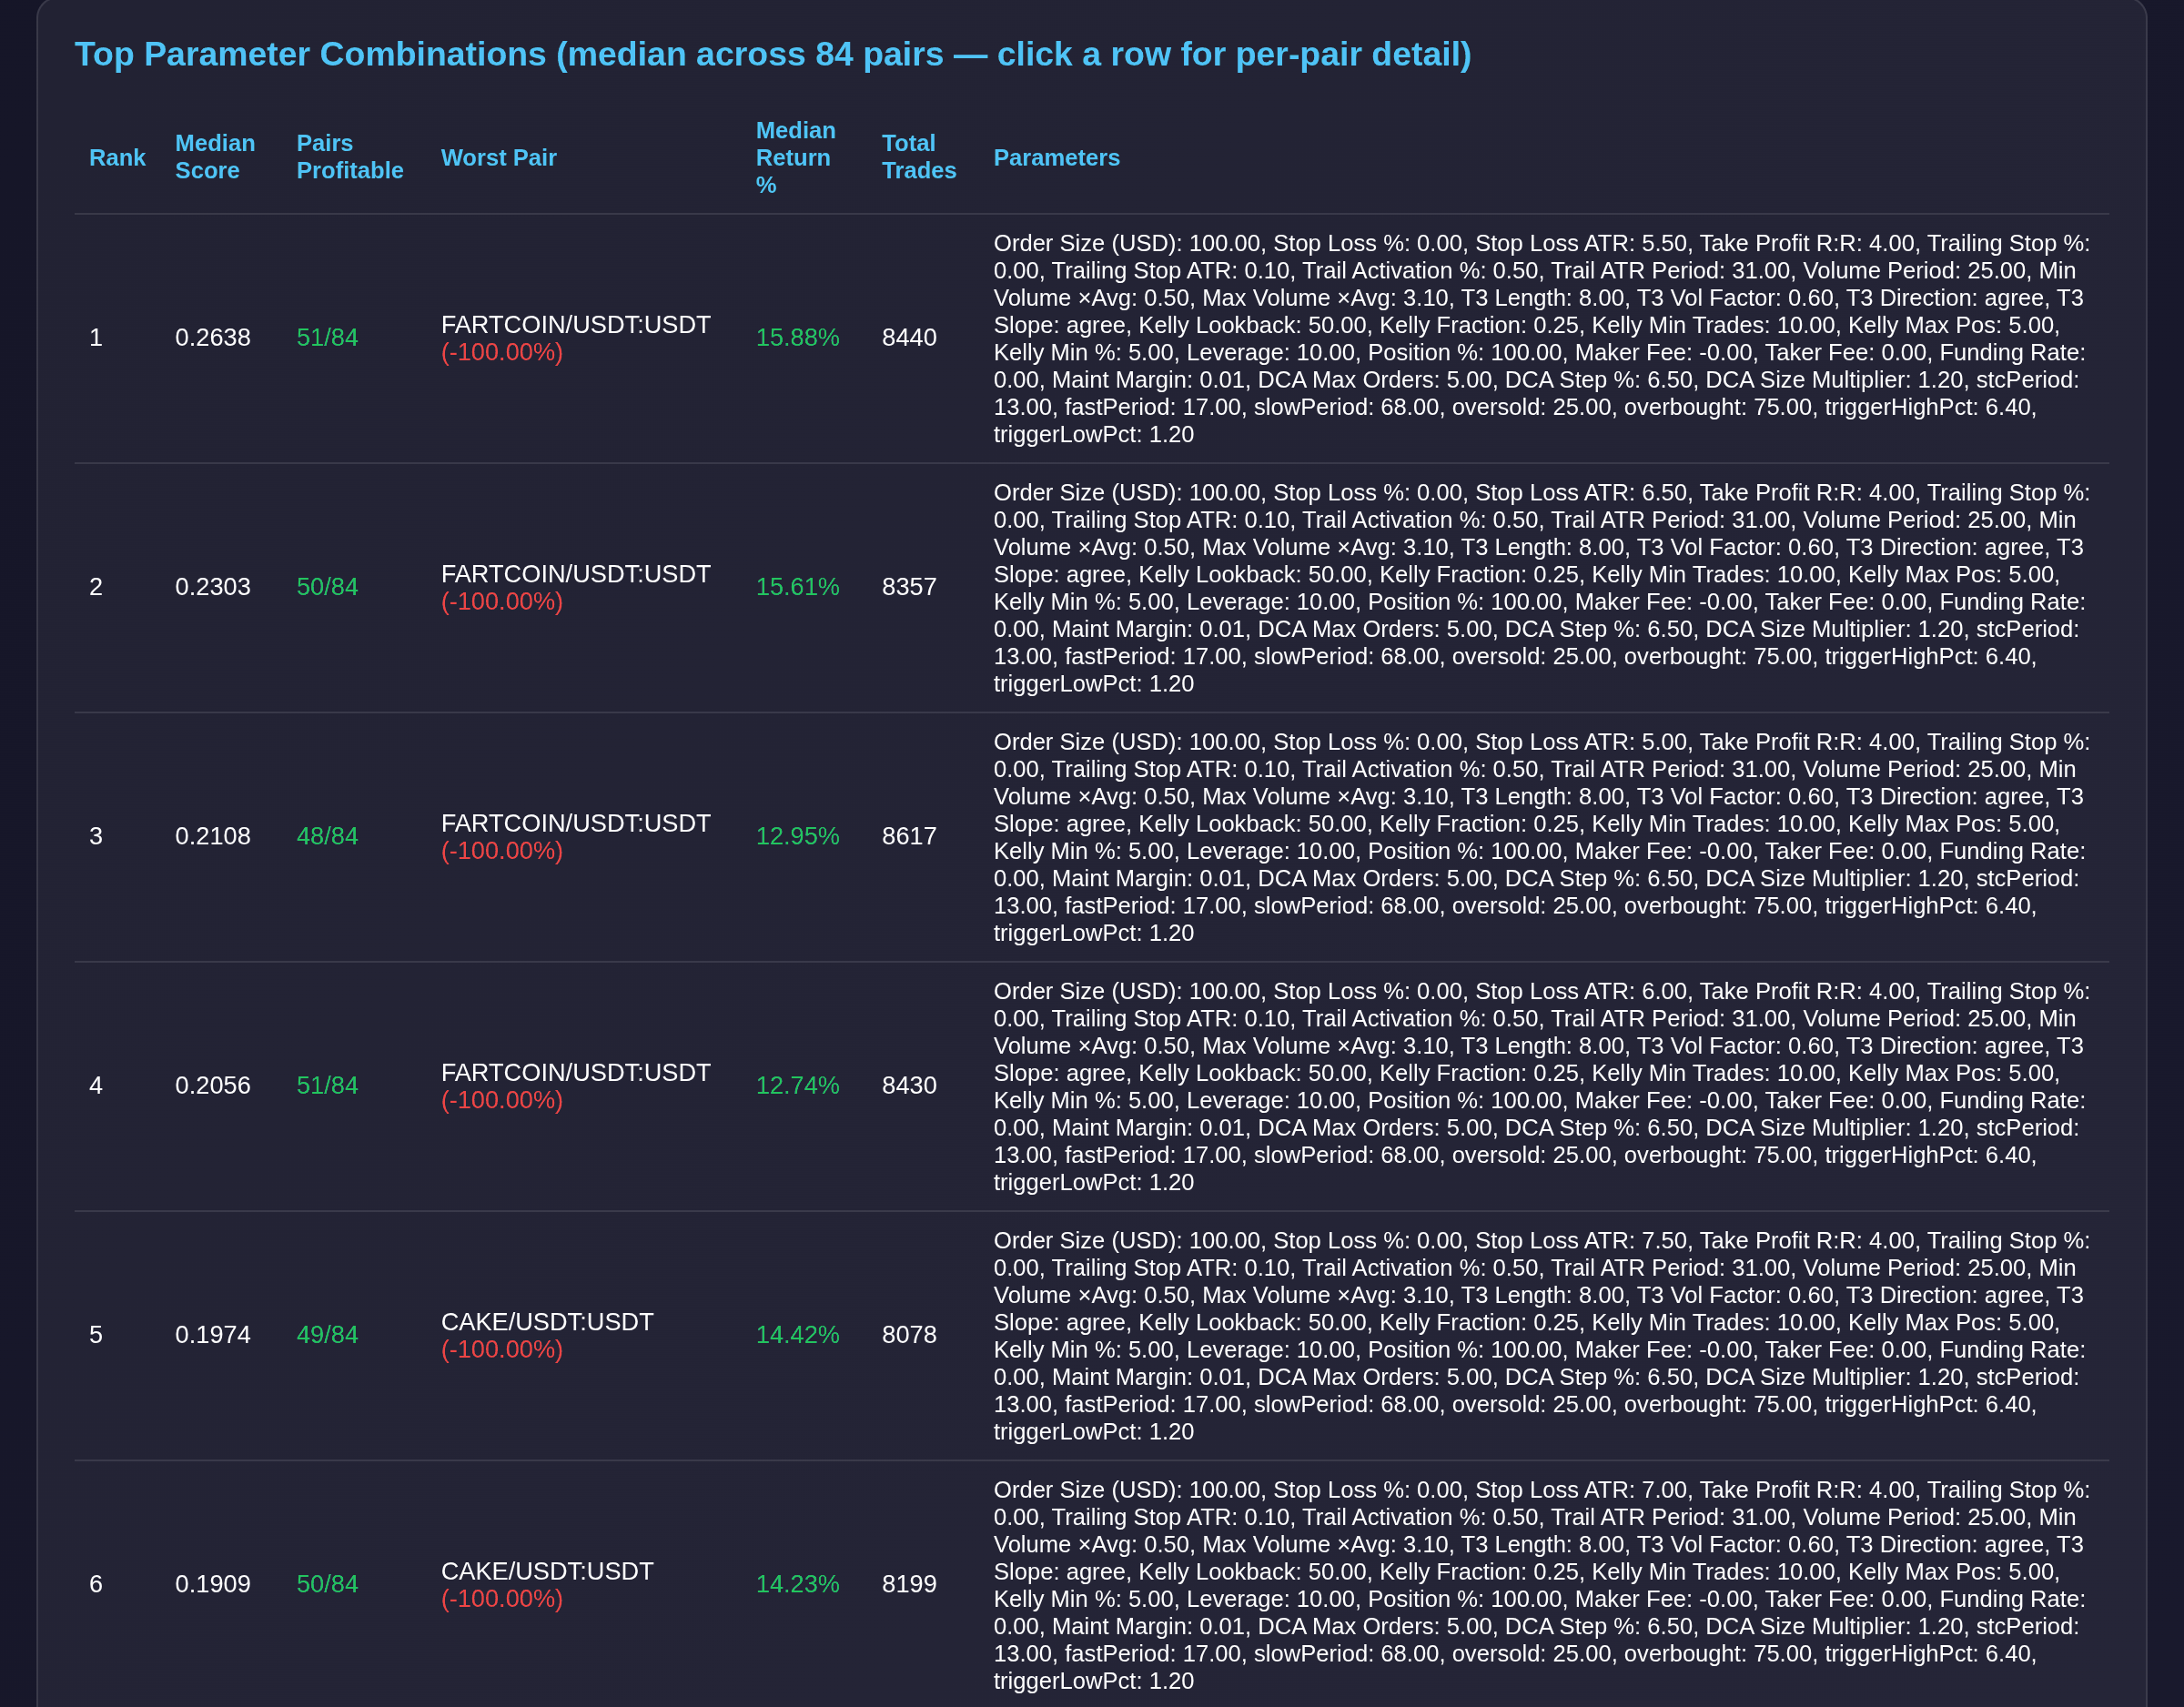
Six combinations ranked by the median across 84 pairs. The two columns worth reading first are Pairs Profitable and Worst Pair: the winner is profitable on 51 of 84 and liquidated one, and both facts sit on the same row rather than one of them being averaged into a single flattering number. Watch a run across every pair.